Everyone still treats 4% yields like it is a weather event. Something that happens, passes, and then we go back to the world where money is free and the only real question is which risk asset to buy. I want to argue the opposite. 4% is not the aberration. The last fifteen years were.
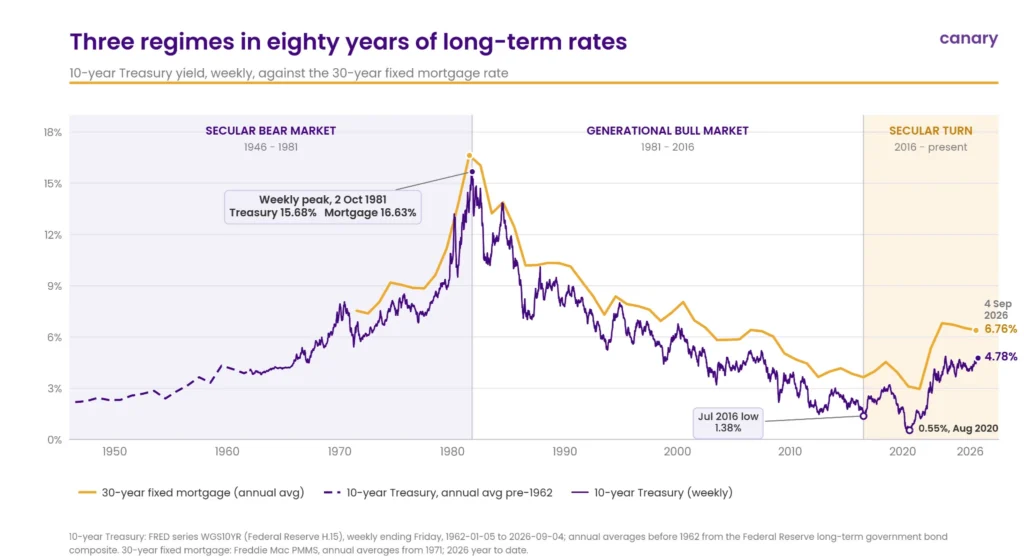
The last generational bull market in bonds ended in 2016. This rally began in 1982, when Paul Volcker’s crushing interest rate hikes finally broke the back of double-digit inflation. The rally was solidified in 1985 when Reagan and Gorbachev initiated efforts to de-escalate the Cold War. The geopolitical shifts of 1989 accelerated the bull market as the Berlin Wall fell, followed by the Malta Summit, where Bush Sr and Gorbachev declared the end of the Cold War era. As defense spending declined and peace dividends were realized, interest rates fell steadily throughout the 1990s. This low-cost capital paved the way for massive dollar deployment into telecommunications infrastructure and, ultimately, the commercial expansion of the internet. However, this sharp surge in capital investment and aggressive e-commerce competition drove down prices across consumer sectors while fueling a speculative technology boom that inevitably burst in 2000. Subsequent rate cuts and speculative momentum shifted liquidity into real estate, setting the stage for the 2008 Great Recession. The Federal Reserve responded with unprecedented rate cuts to zero and balance sheet expansion through quantitative easing, marking the initial formation of a secular top in bond prices. The absolute peak arrived in 2016. While yields briefly plummeted again in 2020, that move was driven strictly by non-economic panic rather than structural market fundamentals.
The concept I want to address is what entering a generational bear market in bonds truly entails. Although we are already a decade past the 2016 peak, historical precedents demonstrate that the two previous secular bond cycles we have clean data for persisted for decades. The 1982-2016 bull market spanned 34 years. Prior to that, the previous bear market began in 1946 and extended 35 years before reaching its ultimate conclusion in 1981.
Think about who was on the other side of that trade. Somebody bought a long Treasury bond in 1946 at about 2.2%. They did everything right. Safest instrument, strongest government on earth, held to maturity the way you are supposed to. They got paid back in full in 1976, in dollars worth about a third of what they lent. That is what a generational bear market does. It never defaults on you. It just takes the money slowly enough that nobody calls it a loss.
Structural Beginnings
The early phase of that post-war cycle appeared deceptively benign, leading many rate historians to pinpoint 1954 as the actual start of the bear market, 3 years after the famous Treasury-Fed Accord of 1951. I argue that our past decade closely parallels that early post-war era, characterized by range-bound yield fluctuations, intermittent bouts of volatility, and a widespread consensus that rates would remain anchored around 3%. Following 1954, the market entered a 15-year period defined by robust economic expansion alongside sustained military spending. Cold War proxy conflicts in Korea and Vietnam escalated fiscal obligations, while geopolitical tensions with Russia and China required persistent defense outlays. This fiscal escalation was compounded by intense domestic political pressures: McCarthyism and pervasive anti-communist sentiment had already made a soft defense posture politically untenable. Bipartisan consensus demanded aggressive military readiness, weapon systems modernization, and expanded foreign aid, effectively institutionalizing high baseline defense budgets. These budget commitments, combined with growing social expenditures, structurally widened deficits and constrained monetary policy options, accelerating the upward drift in yields.
Consumer Impact
During the 1960s, inflation escalated alongside productivity and real GDP growth. The balance sheet story starts a decade earlier. Household debt relative to disposable income ran from 34.8% in 1950 to 58.5% by 1960, more than twenty points in ten years. The 1960s were the follow through rather than the main event. The ratio climbed to 67.9% by 1967, then rolled over and finished the decade at 65.1%, all while annual auto sales surged past 9 million units and housing starts ran between 1.2 and 1.6 million per year. Personal savings rates held in a band between 10% and 12% for the entire decade and then climbed into the 13% range as the 1970s opened. Households were saving more, not less, as inflation accelerated. They were buying cars and houses out of income, and that steady absorption is what anchored demand at progressively higher price levels.
Then the ratio simply stopped moving. It sat at 61.3% in 1970 and 61.2% in 1975, flat for five years, while secular inflation morphed into the stagflation of the 1970s. Persistent price pressures met stagnant growth and ate real wages. The debt only caught up at the end, reaching 71.5% by 1979. The structural breaking point arrived in 1981 when 30-year mortgage rates peaked in the 16 to 18% range, a massive surge from 8.5% in the late 1960s and 5.5% in the late 1950s.
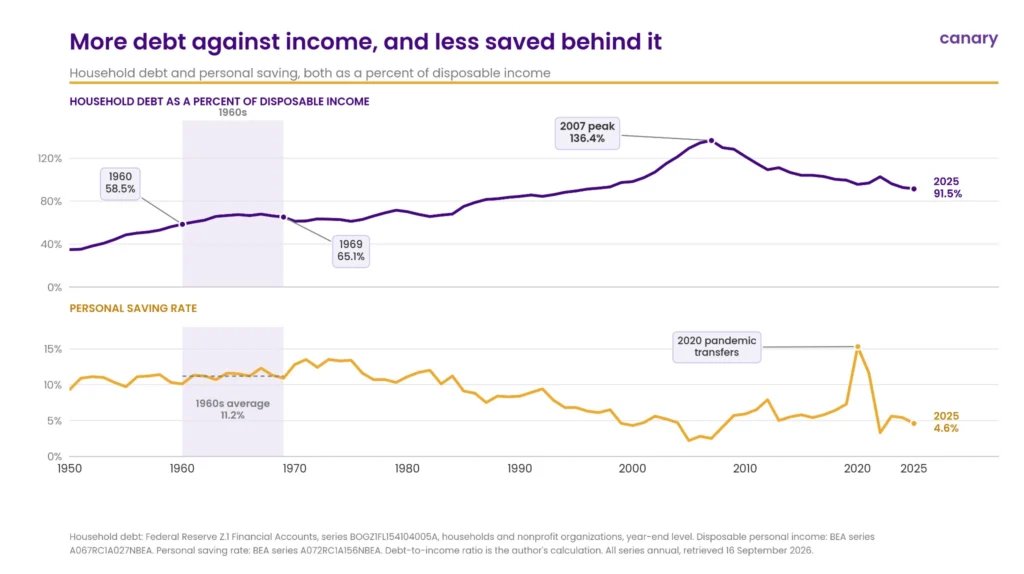
Where are we today in this secular cycle? We are likely positioned equivalent to the early 1960s. We experienced a powerful housing cycle over the past five years, pushing mortgage rates above 7% as 10-year Treasury yields breached 5%. Over the next few years, I expect mortgage rates to advance into the 8.5%, 10% range. Higher rates do not automatically guarantee an immediate recession; consumers will reprice baseline expectations across the board and absorb higher borrowing costs. Once market participants realize yields are structurally ascending, we will witness periods of urgency-driven buying across real estate, automotive, and capital equipment as buyers move to lock in rates before further increases.
Structural Factors Pushing Yields and Inflation Higher
1. Government Spending and Sovereign Debt Issuance
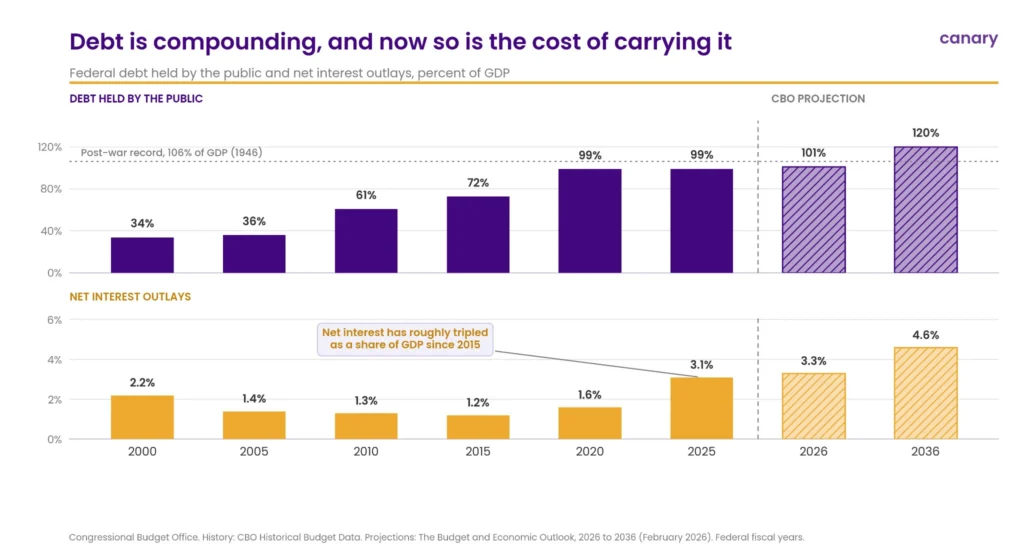
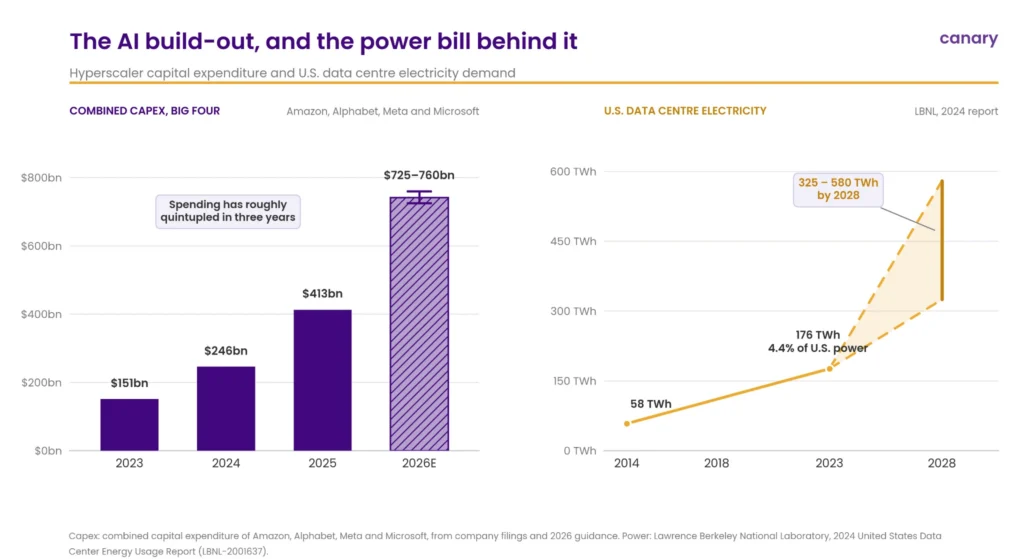
Federal outlays and structural deficit spending have escalated across successive presidential administrations. Compounded by sustained energy cost pressures, massive capital investments in artificial intelligence, and persistent price inflation, global central banks and sovereign treasuries will be forced to raise cash through vast debt issuance. This issuance of government bonds will drive yields higher while reducing the capacity of central bank balance sheets to absorb real assets like gold. Central Banks will likely liquidate portions of their gold reserves to finance energy stockpiles and technology investments when bond markets refuse to absorb additional debt at lower yields.
2. Geopolitical Conflict and Defense Spending
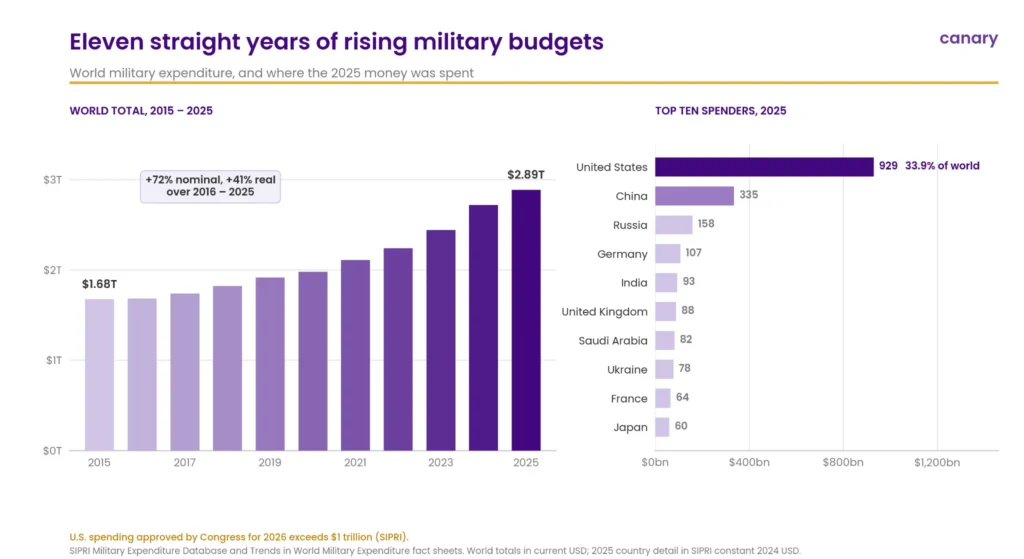
Current geopolitical conflicts in Ukraine and the Middle East represent a primary long-term driver of secular inflation. Ongoing regional wars maintain constant upward pressure on global supply chains and commodity prices. Simultaneously, an expanding cold war posture with China is driving elevated military spending across the Indo-Pacific to secure strategic alliances with Japan, the Philippines, and South Korea. Strategic spending on domestic AI technology functions as a modern form of defense infrastructure spending, accelerating state-directed capital demands.
3. Infrastructure and Energy Transformation
Historically, major infrastructure pushes have reshaped the broader macro landscape. President Dwight D. Eisenhower signed the Federal Aid Highway Act in 1956, initiating the Interstate Highway System and sparking decades of nationwide construction. That initiative catalyzed rapid growth in the automotive, logistics, and hospitality industries while absorbing significant industrial capacity. Today, public and private capital is flowing into artificial intelligence infrastructure, power grids, and data centers.
This transition will reallocate labor across the economy and drive consumer adoption of next-generation technologies. However, it will also generate structural power demand, localized resource constraints, and persistent cost pressures. Elevated inflation, higher baseline interest rates, and ongoing liquidity creation to support critical domestic infrastructure will ultimately favor tangible risk assets and capital-efficient enterprises.
Re-Anchoring Rates
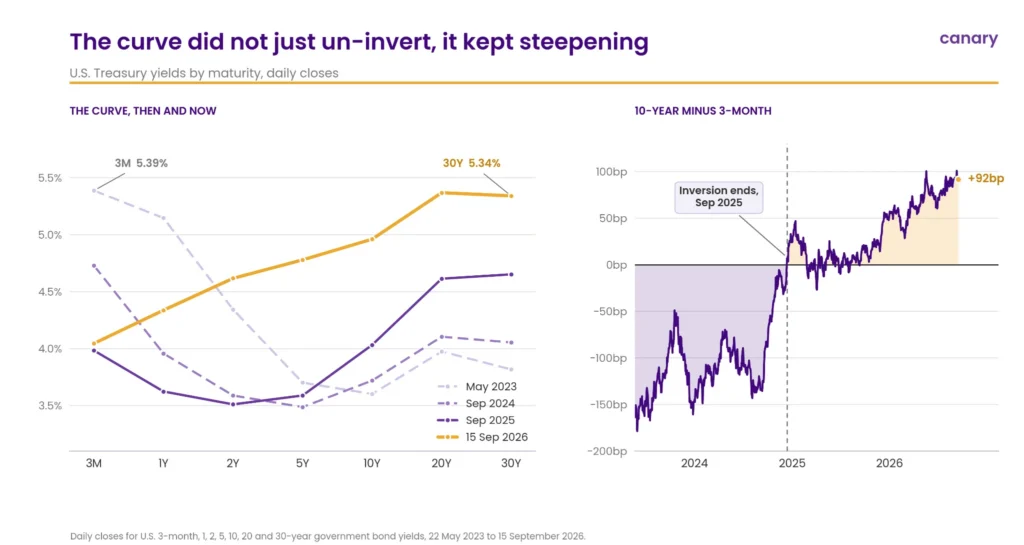
The Federal Reserve must proactively maintain an aggressive policy stance to re-anchor rates, particularly at the long end of the yield curve. Current upward momentum in 10-year and 30-year Treasury yields stems primarily from market perception that monetary policy remains structurally permissive relative to persistent, fiscal-driven inflationary forces. Since May of 2023, the front end came down 134 basis points and the long end went up 152. The Fed got what it wanted at the short end and lost control of everything past two years. A bond market that trusted the Fed would be flattening right now. Instead, it is steepening into the cuts, which is the market telling you it does not believe the inflation fight is finished and it wants to be paid for the risk of finding out.
When central banks delay requisite tightening or signal premature easing, term premiums expand rapidly as bondholders demand higher nominal yields to insulate against sustained purchasing power erosion. Paradoxically, decisive policy rate increases are precisely what is required to flatten the yield curve and suppress long-end yields over time. By establishing a commitment to price stability, proactive central bank action quells long-term inflation risk premiums – potentially pulling 10-year Treasury yields down by 10 to 25 basis points even as short-term rates adjust upward. While election-year political friction creates powerful incentives toward policy pauses or cuts, underlying macroeconomic realities will eventually force additional monetary tightening to prevent a broader sovereign bond selloff.
Market Implications and Asset Allocation
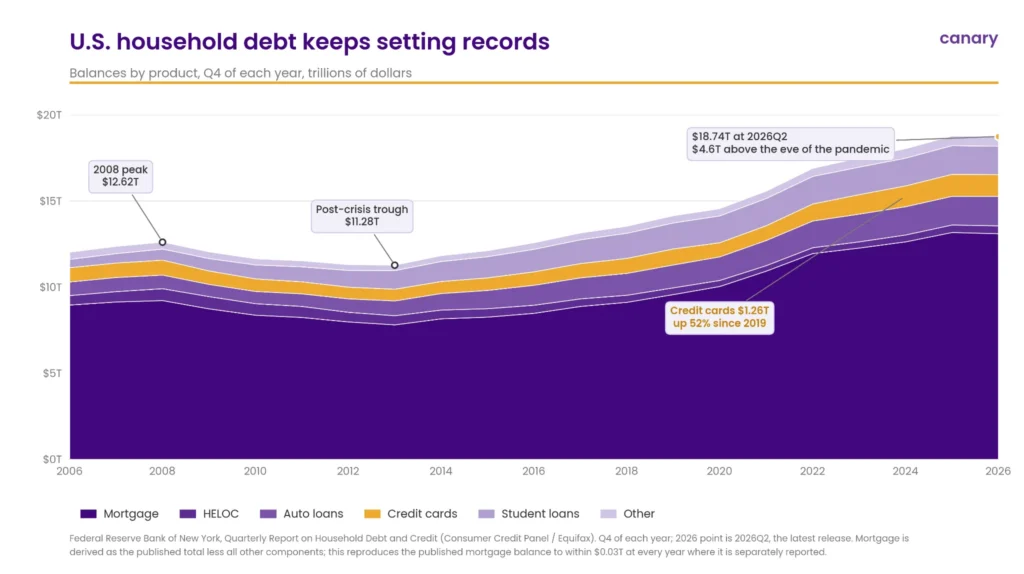
While the debt spiral dynamics are present, the broader economy may continue to stave off formal recession due to low unemployment rates, even as household balance sheets experience profound strain. High baseline costs across housing, energy, and debt service have pushed consumer defaults past anything on record. Auto loan serious delinquency hit 5.5% of balances in Q2 2026, a series record, above the 5.3% peak set in Q4 2010 at the depths of the Great Recession. This has forced widespread down-trading toward value-oriented consumer goods and services. Yet, because massive capital expenditure in artificial intelligence infrastructure, power generation, and advanced manufacturing continues to anchor employment, consumers will maintain the nominal income required to service debt burdens without triggering a collapse in aggregate demand.
Investment Thesis
In this environment, nominal risk assets will continue to appreciate against a structurally depreciating fiat currency. We remain decisively bearish on higher-duration fixed income, while maintaining a strong bullish conviction in non-discretionary equities, real assets, and digital securities.
Cryptocurrency markets run in 4-year cycles, and is currently coming out the the bear leg of a cycle that began in 2022. Crypto markets have formed a bottom. Even though I am now bullish on that sector, it does not mean that there will be some volatility through the end of 2026. We are headed into midterm elections, see continued uncertainty around the Clarity Act (which I believe is largely symbolic), and further layoffs in the broad tech industry. What will make the next 4-year cycle different is RWA tokenization. In previous cycles, Bitcoin has led the charge, with protocols following. This cycle there is strong investment in tokenization of bonds (stablecoins as proof of concept), equities, hard assets, and commodities (call out to ABAXX). This cycle will be led by the best protocols producing tokenized RWAs, with bitcoin serving as the “lower-risk alternative” to the bond bond market. I also believe that a lot of useless tokens will fall short.